The Rapid Growth of Synthetic Graphite and Major Companies
1. Introduction to Anode Materials
1.1 Anode Materials: A Key Component of Lithium-Ion Batteries Anode materials are a crucial component of lithium-ion batteries, significantly influencing their energy density, cycle performance, charge-discharge rate, and low-temperature discharge performance. The operational principle of lithium-ion batteries involves lithium ions migrating from the cathode to the anode during charging. These lithium ions embed themselves in the micropores of the anode material. The more lithium ions the anode can hold, the higher the battery’s charge capacity. During discharge, the lithium ions return to the cathode, determining the battery’s discharge capacity.
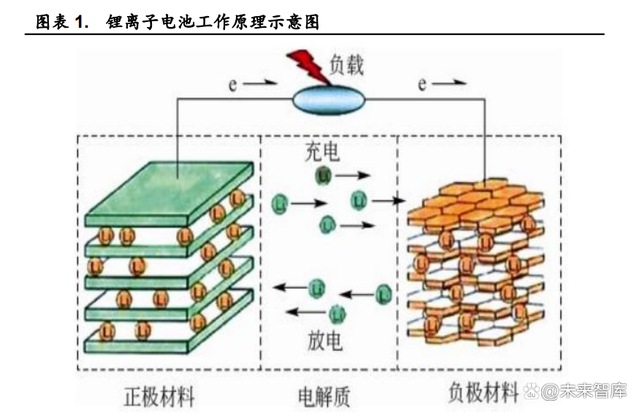
Anode Materials in Lithium-Ion Batteries
In lithium-ion batteries, anode materials account for less than 15% of the total cost. The four main components of lithium-ion batteries are cathode materials, anode materials, electrolytes, and separators, with cost distributions of approximately 40%, 15%, 15%, and 30% respectively.
Diverse Types of Anode Materials with Synthetic Graphite Standing Out
Lithium-ion battery anode materials are primarily divided into carbon-based and non-carbon-based materials. Carbon-based materials include graphite, graphene, and disordered carbon. Currently, graphite anode materials, such as synthetic graphite and natural graphite, are widely used in lithium-ion batteries. Non-carbon-based materials primarily include silicon-based anode materials and lithium titanate anode materials. Silicon-based anode materials can be further categorized into SiO anode materials, silicon-carbon anode materials, and silicon-based alloy anode materials.
The Dominance of Synthetic Graphite and the Emergence of Silicon-Based Anodes
Ongoing Optimization of Graphite Anode Performance
Graphite anode materials each have their advantages, with synthetic graphite being particularly noteworthy. In terms of specific capacity, natural graphite slightly outperforms synthetic graphite. The theoretical capacity of natural graphite anode materials ranges from 340 to 370 mAh/g, whereas synthetic graphite anode materials range from 310 to 360 mAh/g. However, synthetic graphite outperforms natural graphite in cycle performance. According to data from BTR, natural graphite (GSN products) has a cycle life of around 500 cycles, while synthetic graphite (AGP-2L-P) can reach up to 6000 cycles. This is mainly because natural graphite particles have inconsistent sizes and numerous surface defects, which make them more reactive with electrolytes and thus degrade cycle performance.
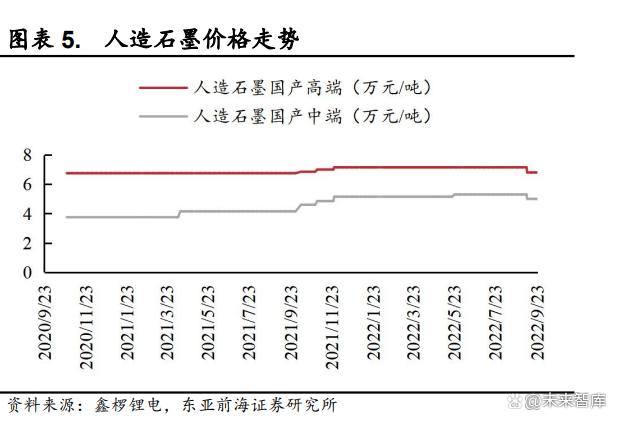
From an expansion rate perspective, natural graphite has a higher expansion rate than synthetic graphite. This is primarily due to the higher crystallinity and large, anisotropic layer structure of flake graphite, leading to significant volume changes during lithium intercalation and deintercalation. In terms of production cost and selling price, synthetic graphite is more expensive than natural graphite. This is primarily due to the more complex production process. According to Xinluo Lithium Battery statistics (as of September 23, 2022), the average price of high-end natural graphite anodes is approximately 61,000 yuan per ton, while high-end synthetic graphite anodes are around 68,000 yuan per ton.
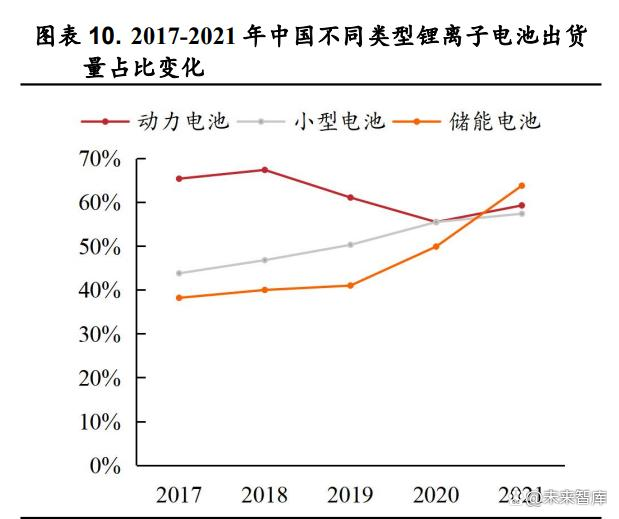
The development of new energy vehicles is rapid, with a strong demand for power batteries. Demand for new energy vehicles has greatly increased, and production and sales continue to rise. In 2021, global and Chinese sales of new energy vehicles were 6.5 million and 3.52 million respectively, up by +108% and +157% year-on-year. The strong demand for new energy vehicles has driven the growth in shipments of lithium-ion power batteries. In 2021, global and Chinese shipments of lithium-ion power batteries were 371 GWh and 220 GWh respectively, up by +135% and +160% year-on-year.
Wind and solar power generation are developing in parallel, with energy storage deployment accelerating. There is strong downstream demand for lithium-ion energy storage batteries globally and in China, with rapid growth in shipments. According to EVTank data, in 2021, global and Chinese shipments of lithium-i
on energy storage batteries were 66.3 GWh and 42.3 GWh respectively, up by +132.53% and +197.43% year-on-year. According to data from the National Energy Administration, China’s cumulative energy storage installation capacity in 2021 was 43.44 GW, up by +22.02% year-on-year. Growth points for downstream demand include:
1) A significant increase in new energy installation capacity, driving up energy storage demand. According to the National Energy Administration, cumulative installed capacity of wind and photovoltaic power generation in China reached 534.6 GW and 637.1 GW respectively in 2020 and 2021, up by +28.92% and +19.62% year-on-year. The annual newly installed capacity of wind and photovoltaic power in China in 2020 was 71.69 GW and 48.28 GW respectively, up by +178.44% and +60.35% year-on-year. Considering the characteristics of new energy, its generation is intermittent, thus necessitating energy storage to address issues such as renewable energy integration and grid stability. From a policy perspective, there is a requirement for mandatory storage of 10%-20% for new energy, with a duration of 2 hours;
2) The proportion of electrochemical energy storage technology continues to rise. According to CNESA, the proportion of global and Chinese electrochemical energy storage has been increasing. As of 2021, the cumulative installed capacity of electrochemical energy storage globally and in China accounted for 10.05% and 11.8% respectively. Cost reduction is a key factor driving the development of electrochemical energy storage;
3) The cost of electrochemical energy storage has decreased significantly, gradually improving the economic feasibility of storage. According to the prospectus of Paine Technology, in 2021, the cost and normalized cost of household energy storage systems were $450/kWh and $0.07/kWh respectively.
5G smartphones and wearable devices are soaring, with stable growth in demand for small lithium batteries. Global and Chinese lithium-ion batteries are growing steadily. According to EVTank, global and Chinese shipments of small lithium-ion batteries continued to climb. In 2021, global and Chinese shipments of small lithium-ion batteries were 125.10 GWh and 71.81 GWh respectively, up by +16.05% and +20.08% year-on-year.
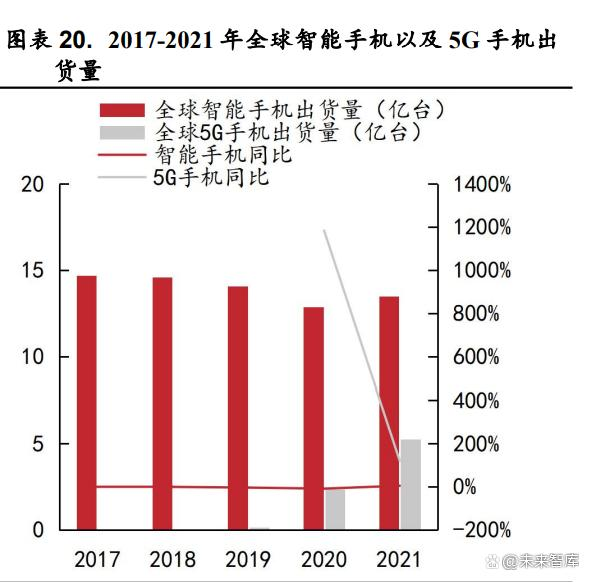
Demand growth and product upgrades are driving the growth of small lithium-ion batteries: 1) High growth in 5G smartphone sales is boosting lithium battery demand. According to IDC data, global shipments of 5G smartphones in 2020 and 2021 were 240 million units and 530 million units respectively, up by +1183.42% and +120.83% year-on-year. The power consumption of 5G smartphone chips is 2.5 times that of 4G smartphone chips. Due to the increased power consumption of 5G smartphones, battery capacity will significantly increase to ensure longer battery life.
2) Wearable devices have become a new growth point. Global sales of wearable devices continue to reach new highs. According to IDC data, global sales of wearable devices reached 533 million units in 2021, up by +19.86% year-on-year. Within the product structure of wearable devices, smart headphones and smart watches dominate, accounting for 58.16% and 23.92% respectively in 2021. Looking ahead, AR and VR are expected to create new demand for small lithium-ion batteries.
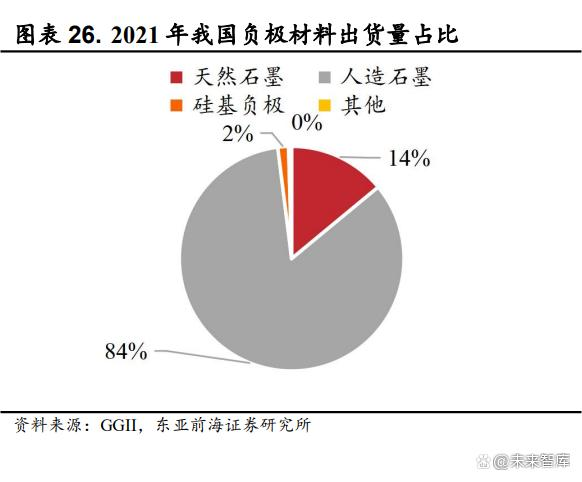
- Natural Graphite: From 2017 to 2021, China’s shipments of natural graphite increased gradually but at a slower pace compared to artificial graphite and silicon-based anodes. In 2021, shipments were 10.08 thousand tons, with a year-on-year growth of 73%. The increase in 2020 and 2021 was largely due to rising sales of electric vehicles. However, natural graphite’s lower energy density limits its overall shipment volume and growth rate compared to artificial graphite.
- Artificial Graphite: Artificial graphite demonstrated strong performance from 2018 to 2021, with shipments in China increasing from 13.3 to 60.5 thousand tons. This represents year-on-year growth rates of 32%, 56%, 48%, and 97%, respectively. In 2021, artificial graphite accounted for 84% of total shipments, up 5% from the previous year. The high growth in shipments is attributed to increased demand from electric vehicles requiring higher energy density.
- Silicon-Based Anodes: Silicon-based anodes showed continuous growth potential as a significant negative electrode material. Shipments in China increased from 0.25 to 1.1 thousand tons from 2018 to 2021, with year-on-year growth rates of 56%, 48%, 62%, and 83%, respectively.
- The overseas demand for natural graphite is approximately 4/4/6/6 million tons respectively; 3) Silicon-based anode, the domestic demand from 2022 to 2025 is approximately 0.2/0.6/2/4 million tons respectively, and the overseas demand is approximately 0.2/0.6/2/4 million tons respectively. 0.8/2/3/50,000 tons;
2) Consumer batteries (including power tools): The growth rate of batteries in the consumer field is relatively small and the growth rate is relatively slow. We assume that domestic consumer battery shipments from 2022 to 2025 are 83/93/105/117GWh respectively; overseas consumer battery shipments from 2022 to 2025 are 61/69/78/87GWh respectively. 1) Artificial graphite, the domestic demand for 2022-2025 is about 7/7/8/8 million tons respectively, and the overseas demand for artificial graphite is about 5/5/5/5 million tons respectively; 2) Natural graphite, 2022- In 2025, domestic demand is approximately 1/1/1/1 million tons respectively, and overseas demand for natural graphite is approximately 1/1/1/1 million tons respectively;
3) Silicon-based anodes, domestic demand from 2022 to 2025 will be approximately 0.4/0.4/0.9/10,000 tons, respectively, and overseas demand will be approximately 0.3/0.4/0.9/10,000 tons respectively; 3) Energy storage batteries: from The growth rate of fast energy storage is relatively fast, due to the high growth of new energy installed capacity and the growth of overseas demand. We assume that domestic energy storage battery shipments from 2022 to 2025 are 83/93/105/117GWh respectively; overseas energy storage battery shipments from 2022 to 2025 are 61/69/78/87GWh respectively.
- 4) The consumption per GWh of anode materials: With the update of anode material processes and technologies, the consumption per GWh has shown an overall downward trend. We assume that the unit GWh consumption of artificial graphite from 2022 to 2025 is 0.11/0.10/0.10/0.09 million tons/GWh respectively; the unit GWh consumption of natural graphite from 2022 to 2025 is 0.11/0.10/0.10/0.09 million tons/GWh respectively; 2022 -The single GWh consumption of silicon-based anodes in 2025 is 0.09/0.09/0.08/0.08 million tons/GWh respectively;
5) Calculation of anode material demand: From the perspective of global anode material demand, the demand for artificial graphite from 2022 to 2025 is 91/109/131/1.53 million tons respectively; the demand for natural graphite from 2022 to 2025 is 13/15/19/22 respectively 10,000 tons; the demand for anode materials from 2022 to 2025 is 1.72/3.56/6.83/121.9 thousand tons respectively.
- The supply of anode materials is tight in the short term and there is a risk of overcapacity in the long term.
4.1. Evolution from “Three Large and Small” to “Four Large and Small”
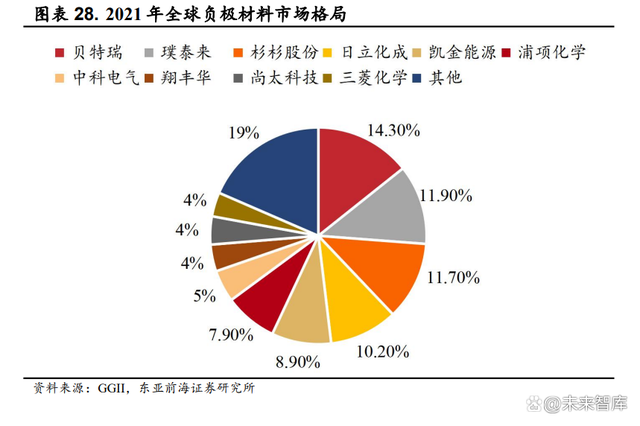
The anode industry is highly concentrated, and the domestic competition pattern is gradually moving toward “four large and small” industries. From the perspective of the global competition landscape, in 2021, the market shares of Beterui, Putilai, and Shanshan Shares will be 14.3%/11.9%/11.7% respectively, and their market shares are relatively stable. In 2021, China accounted for 86.10% of the global anode material market, much higher than other countries. From the perspective of the domestic competition pattern, the domestic competition pattern has changed slightly, and the trend of “four large and small” has gradually become apparent. In 2021, the proportions of Beterui, Putilai, Shanshan Shares, and Kaijin Energy will be 21%/12%/12%/11% respectively. Kaijin Energy’s share is gradually approaching the first echelon.
- 4.2. The supply and demand of anode materials are tightly balanced in the short term, and oversupply may occur in the long term.
The production capacity of anode materials is expanding rapidly, and there is a risk of overcapacity in the long run. According to statistics from the Huaying Research Institute, the total nominal production capacity of global anode manufacturers in 2021 is 1.1 million tons, of which Chinese anode manufacturers have a total production capacity of 940,000 tons, accounting for 85%, and South Korea and Japan have a total production capacity of 160,000 tons, accounting for 15%. According to announcements from various companies, the production capacities of mainstream anode material listed companies Putilai, Beterui, Shanshan Co., Ltd., Zhongke Electric, and Xiangfenghua in 2021 are 15.00/14.47/12.00/6.64/35,000 tons respectively. According to Baichuan Yingfu’s big data statistics, the total planned production capacity of domestic manufacturers in 2021 and 2022 is 6.52 million tons.
- The advantages of “graphitization + integration” enterprises are highlighted, and silicon-based anodes are the future development direction
5.1. Affected by “dual control + power limitation”, graphitization supply may still be insufficient in the short term
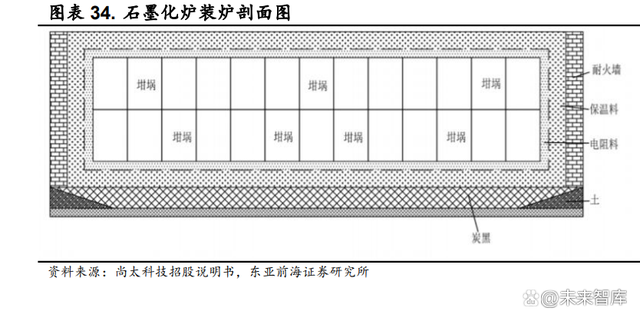
Graphitization is the only way for artificial graphite. Graphitization is a process in which materials are heated according to a certain temperature rise curve until the materials are converted into graphite products. This process is based on the movement caused by thermal energy, which further enriches carbon and realizes the transformation of carbon atoms from a turbostratic structure to a graphite crystal structure. Orderly transformation. The graphitization process is to put the main material evenly into the graphite crucible, and then hoist it flatly into the graphitization furnace through a crane. Put the resistance material into the periphery of the graphite crucible at the furnace core, cover it with insulation material, and fill the furnace body. full, the furnace loading is completed. After the furnace body is filled, it enters the electric heating process. Electric heating is carried out through the electrodes on both sides of the graphitization furnace, and the time usually does not exceed 48 hours. After the furnace reaches a certain temperature, the top of the furnace is covered and a gas collecting hood is installed. The temperature in the furnace will continue to rise to 2800℃-3000℃, and finally The carbon material in the crucible is subjected to high-temperature heat treatment to make it have the characteristics of graphite crystal structure. After the electric heating is completed, open the top of the furnace and let it cool until the material returns to normal temperature, which ends the production process. Normally, a cycle of graphitization process or purification process will take 15-22 days.
- Supply-Demand Mismatch: Due to high energy consumption and slow capacity expansion, China’s graphiteization industry may face a supply shortage in 2023. Estimates from Head Leopard Research Institute suggest that in 2022, supply and demand were 720,000 tons and 640,000 tons respectively, while in 2023, supply is projected to be 853,000 tons against demand of 914,000 tons.
- Energy Consumption: Graphiteization processes are energy-intensive, with major furnace types like Acheson and internal series consuming between 3300 to 4800 kWh per ton. Most of China’s graphiteization capacity is concentrated in regions like Inner Mongolia (41%), Sichuan (17%), Shanxi (12%), and Qinghai (8%), based on electricity supply capabilities and pricing distribution.
- Market Structure: The graphiteization market is fragmented, with external processing (outsourcing) accounting for 63% in 2021. Listed companies like Pulead Technology dominate with a 13% market share.
- Policy Impact: Government policies, including dual control measures aimed at energy consumption and total emissions, have restricted capacity expansion in the graphiteization sector. Regions like Inner Mongolia have implemented strict controls to achieve annual energy intensity reduction targets.
- Integration Trends: Integration is crucial for cost reduction in negative electrode material production, with self-supply of graphiteization being a priority. This trend is prominent among leading enterprises aiming to reduce costs amidst rising electricity prices and regulatory pressures.
