

CNT Loading Level vs Thermal Conductivity – Where Is the Sweet Spot?
1. Why CNT Loading Is Not “More Is Better”
When carbon nanotubes (CNTs) are introduced into polymers, coatings, or thermal interface materials (TIMs), the first instinct is often simple:
Higher CNT content = higher thermal conductivity.
In reality, this assumption frequently leads to:
-
Diminishing thermal returns
-
Poor processability
-
Mechanical failure
-
Higher cost with limited performance gain
The true challenge is identifying the sweet spot—the CNT loading range where thermal conductivity improves efficiently without compromising processing, reliability, or economics.
2. Thermal Transport in CNT Networks: A Quick Recap
CNT-enhanced thermal conductivity depends on network formation, not individual nanotubes.
Key mechanisms include:
-
CNT–CNT contact continuity
-
Phonon transport across junctions
-
Interface resistance between CNTs and matrix
-
Mechanical conformity at interfaces
Before a continuous network forms, CNTs behave as isolated fillers with minimal thermal impact.
3. The Percolation Threshold: Where Heat Paths Begin
3.1 What Is Thermal Percolation?
The thermal percolation threshold is the CNT loading level at which:
-
CNTs begin forming continuous heat-conducting pathways
-
Thermal conductivity increases rapidly with small loading increments
This threshold is influenced by:
-
CNT aspect ratio
-
Dispersion quality
-
Alignment
-
Matrix viscosity
Typical thermal percolation ranges:
-
Well-dispersed CNTs: ~0.5–2 wt%
-
Agglomerated systems: >3 wt%
3.2 Below Percolation: Minimal Benefit
At very low CNT loading:
-
CNTs are isolated
-
Heat still flows mainly through the polymer
-
Thermal conductivity gain is marginal
➡ Below percolation, CNTs add cost but little performance.
4. The Sweet Spot: Rapid Thermal Gains with Minimal Penalty
4.1 The Optimal Loading Window
In most thermal coatings, TIMs, and composites, the sweet spot typically lies in the range of:
1–3 wt% CNT (or equivalent volume fraction)
Within this window:
-
CNT networks are continuous
-
Thermal conductivity increases efficiently
-
Viscosity remains manageable
-
Mechanical properties remain stable
This is where performance per gram of CNT is maximized.
4.2 Why Gains Flatten Beyond the Sweet Spot
As CNT loading increases further:
-
CNT–CNT contacts increase
-
Agglomeration becomes dominant
-
Phonon scattering at junctions rises
-
Matrix continuity is disrupted
The result:
-
Smaller incremental thermal gains
-
Larger penalties in processing and reliability
5. High Loading Regime: When CNTs Start Working Against You
At high CNT loading levels (>3–5 wt%):
Thermal Issues
-
Increased junction resistance
-
Random orientation limits effective heat flow
-
Diminishing conductivity slope
Processing Issues
-
Sharp viscosity increase
-
Poor flow and leveling
-
Difficult coating or molding
Mechanical & Reliability Issues
-
Reduced adhesion
-
Increased brittleness
-
Cracking under thermal cycling
➡ Beyond a certain point, CNTs degrade system-level performance.
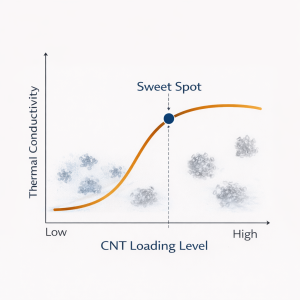
6. CNT Loading vs Thermal Conductivity: Typical Trend
Conceptually, the relationship looks like this:
-
Low loading: Flat thermal response
-
Near percolation: Steep conductivity rise
-
Sweet spot: Best efficiency
-
High loading: Plateau or instability
This non-linear behavior explains why engineering optimization matters more than raw CNT content.
7. CNT Loading Depends on Application Type
| Application | Typical CNT Sweet Spot |
|---|---|
| Thermal interface materials (TIMs) | 0.5–2 wt% |
| Thermal coatings | 1–3 wt% |
| Structural composites | 1–4 wt% |
| Gap fillers | 0.3–1.5 wt% |
| Hybrid CNT–graphene systems | Lower CNT loading |
Hybrid systems often shift the sweet spot downward, reducing total filler demand.
8. Role of Dispersion: The Hidden Variable
CNT loading alone is meaningless without dispersion quality.
-
Poor dispersion → higher percolation threshold
-
Good dispersion → lower CNT requirement
-
Agglomerates → false “high loading” without effective pathways
In many cases:
Improving dispersion is more effective than adding more CNTs.
9. Cost–Performance Optimization
CNTs are among the most expensive fillers in thermal systems.
Optimizing loading:
-
Reduces material cost
-
Improves yield and consistency
-
Simplifies processing
-
Enhances long-term stability
From a product perspective, the sweet spot delivers the highest ROI, not the highest conductivity number.
10. Engineering Design Takeaways
-
CNT thermal performance is network-driven, not content-driven
-
Identify the percolation threshold early
-
Target the 1–3 wt% range for most systems
-
Avoid chasing diminishing returns at high loading
-
Optimize dispersion before increasing CNT content
The best thermal performance does not come from maximum CNT loading—it comes from maximum efficiency of CNT networks.
Finding the sweet spot between thermal conductivity, processability, and reliability is the difference between:
-
A lab formulation
-
And a scalable, industrial-grade thermal solution
Smart CNT loading is not about adding more—it is about adding just enough.